> ## Documentation Index
> Fetch the complete documentation index at: https://docs.boltz.bio/llms.txt
> Use this file to discover all available pages before exploring further.
# Results & Triage
> Analyze virtual screen results and collaboratively prioritize molecules
## Results Table
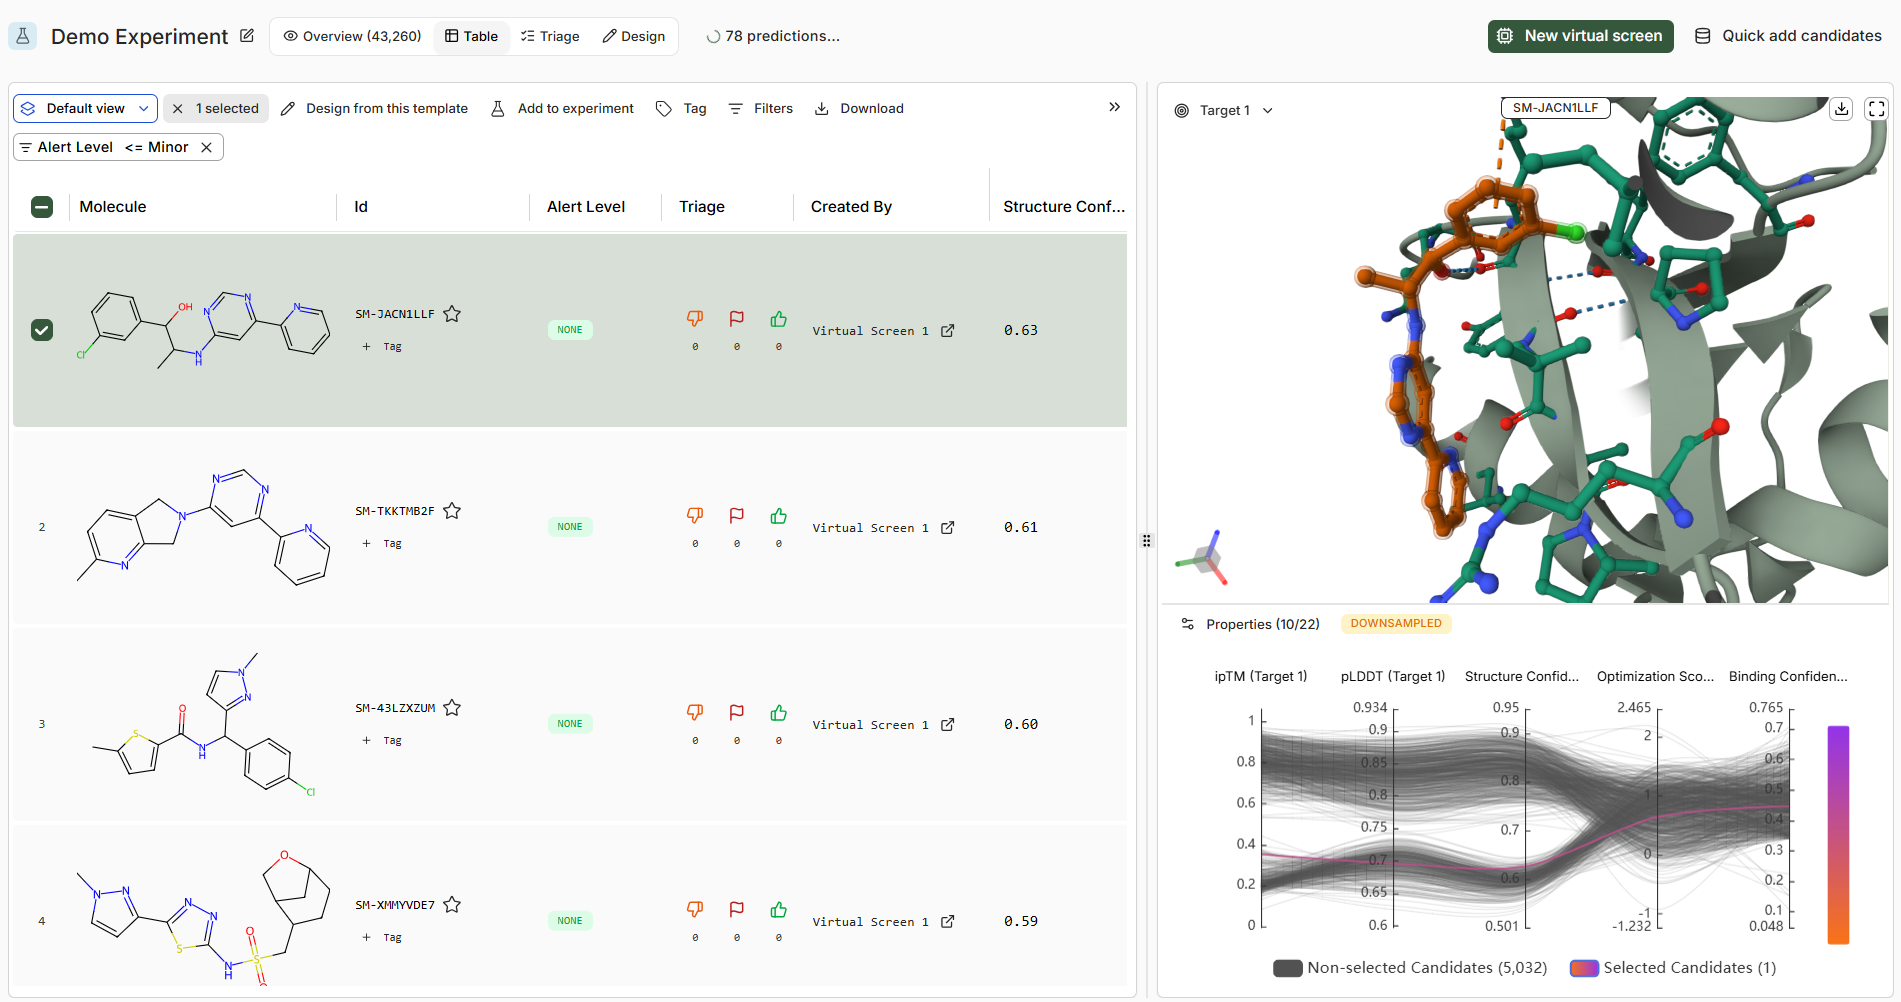
Navigating to an **Experiment** shows the results table from all Virtual Screens it contains. The Table UI is divided into three sections: a data table, MolStar viewer, and a progressive flow chart of affinity predictions and RDKit descriptors.
 ### Table Features
| Feature | Description |
| --------------------- | -------------------------------------------------------------------------------------------------------------------------- |
| **Selecting a row** | Loads molecule into the viewer. Clicking the checkbox, multiple (up to 10) molecules can be selected and overlaid. |
| **ID and Tags** | Unique ID for the molecule. Click the ⭐ to mark as 'active' in the Catalog. Tags allow labelling with contextual keywords. |
| **Alert Level** | Indicates if the molecule hits any structural alert filters. |
| **Triage Elements** | Upvote/Downvote + Flag buttons for annotation. Connected to the Triage UI. |
| **Boltz Metrics** | Metrics for each prediction, grouped by target if multiple exist. |
| **RDKit Descriptors** | Standard molecular descriptors for triage and analysis. |
| **Columns + Sorting** | Toggle columns, drag to rearrange, click headers to sort. |
| **Filters** | Numeric sliders and text/contextual filters available. |
| **Download** | Export all molecules and metrics from the table. |
Results are downsampled to a couple thousand at most for user convienience.\
\
Sorting by a column will display to top results, with additional filters then applied to show the highest fidelity hits
Download will provide an output data file of all molecules in the downsample, or remaining after filters are applied.\
\
Selecting molecules will only download the data for those molecules.\
\
Please contact support for any additional download requests
***
### Boltz Scoring Metrics
Primary scoring function for **hit discovery**. Continuous score between 0 and 1, with 1 being highest confidence of binding.
This is similar to the affinity probability output of Boltz-2.
Scoring function for **lead optimization** settings where relative ranking within a series matters. Continuous score between 0 and 1, with 1 being the strongest binder.
This is similar to the affinity value output of Boltz-2.
Measure of confidence on the correctness of the structure prediction, combines pLDDT and ipTM score.
Continuous score between 0 and 1, with 1 being highest confidence.
### Viewer Features
Note that, for large targets, the model focuses the prediction in the pocket selected in the Target creation stage. If you are looking for the molecules to bind to a different pocket, add a new target. If you are looking to analyze the specific conformational changes on the full target from a ligand binding, use the Sandbox.
| Feature | Description |
| ---------------------- | ------------------------------------------------------------------------- |
| **Multiple selection** | Up to 10 molecules can be overlaid. Selecting more displays the first 10. |
| **Click molecule** | Loads nearby pocket residues and highlights proposed interactions. |
| **Download** | Top-right button exports 3D structures of loaded molecules. |
### Progressive Flow Chart
This 2D plot visualizes relative scores across various Boltz affinity metrics or RDKit descriptors within the screen.
### Table Features
| Feature | Description |
| --------------------- | -------------------------------------------------------------------------------------------------------------------------- |
| **Selecting a row** | Loads molecule into the viewer. Clicking the checkbox, multiple (up to 10) molecules can be selected and overlaid. |
| **ID and Tags** | Unique ID for the molecule. Click the ⭐ to mark as 'active' in the Catalog. Tags allow labelling with contextual keywords. |
| **Alert Level** | Indicates if the molecule hits any structural alert filters. |
| **Triage Elements** | Upvote/Downvote + Flag buttons for annotation. Connected to the Triage UI. |
| **Boltz Metrics** | Metrics for each prediction, grouped by target if multiple exist. |
| **RDKit Descriptors** | Standard molecular descriptors for triage and analysis. |
| **Columns + Sorting** | Toggle columns, drag to rearrange, click headers to sort. |
| **Filters** | Numeric sliders and text/contextual filters available. |
| **Download** | Export all molecules and metrics from the table. |
Results are downsampled to a couple thousand at most for user convienience.\
\
Sorting by a column will display to top results, with additional filters then applied to show the highest fidelity hits
Download will provide an output data file of all molecules in the downsample, or remaining after filters are applied.\
\
Selecting molecules will only download the data for those molecules.\
\
Please contact support for any additional download requests
***
### Boltz Scoring Metrics
Primary scoring function for **hit discovery**. Continuous score between 0 and 1, with 1 being highest confidence of binding.
This is similar to the affinity probability output of Boltz-2.
Scoring function for **lead optimization** settings where relative ranking within a series matters. Continuous score between 0 and 1, with 1 being the strongest binder.
This is similar to the affinity value output of Boltz-2.
Measure of confidence on the correctness of the structure prediction, combines pLDDT and ipTM score.
Continuous score between 0 and 1, with 1 being highest confidence.
### Viewer Features
Note that, for large targets, the model focuses the prediction in the pocket selected in the Target creation stage. If you are looking for the molecules to bind to a different pocket, add a new target. If you are looking to analyze the specific conformational changes on the full target from a ligand binding, use the Sandbox.
| Feature | Description |
| ---------------------- | ------------------------------------------------------------------------- |
| **Multiple selection** | Up to 10 molecules can be overlaid. Selecting more displays the first 10. |
| **Click molecule** | Loads nearby pocket residues and highlights proposed interactions. |
| **Download** | Top-right button exports 3D structures of loaded molecules. |
### Progressive Flow Chart
This 2D plot visualizes relative scores across various Boltz affinity metrics or RDKit descriptors within the screen.
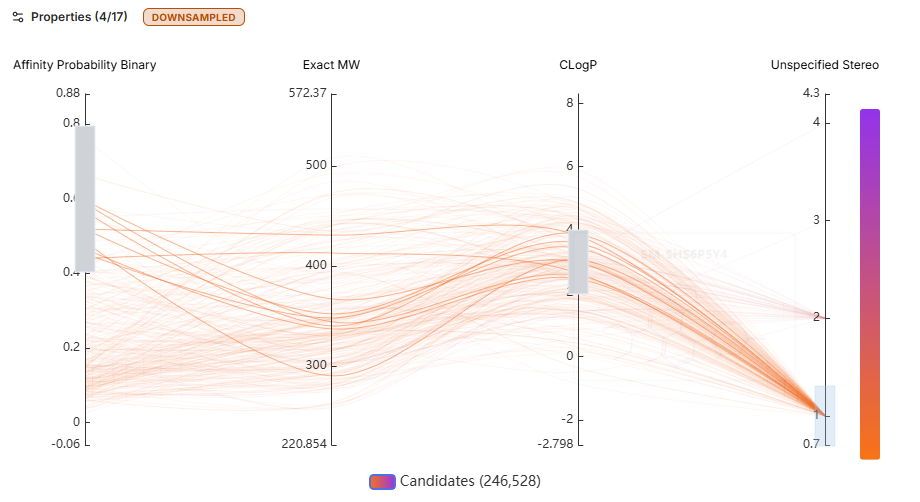 Click and drag over a vertical column to apply filter ranges to the dataset. Highlighted lines show molecule trajectories through these filters. The table updates to show only molecules within the filtered ranges.
Hover over a line to display the molecular structure and ID in the tooltip.
***
## Triage UI
The **Triage** UI allows collaborative or independent assessment of virtual screen output with a focused, structure-centric view for each molecule design.
Click and drag over a vertical column to apply filter ranges to the dataset. Highlighted lines show molecule trajectories through these filters. The table updates to show only molecules within the filtered ranges.
Hover over a line to display the molecular structure and ID in the tooltip.
***
## Triage UI
The **Triage** UI allows collaborative or independent assessment of virtual screen output with a focused, structure-centric view for each molecule design.
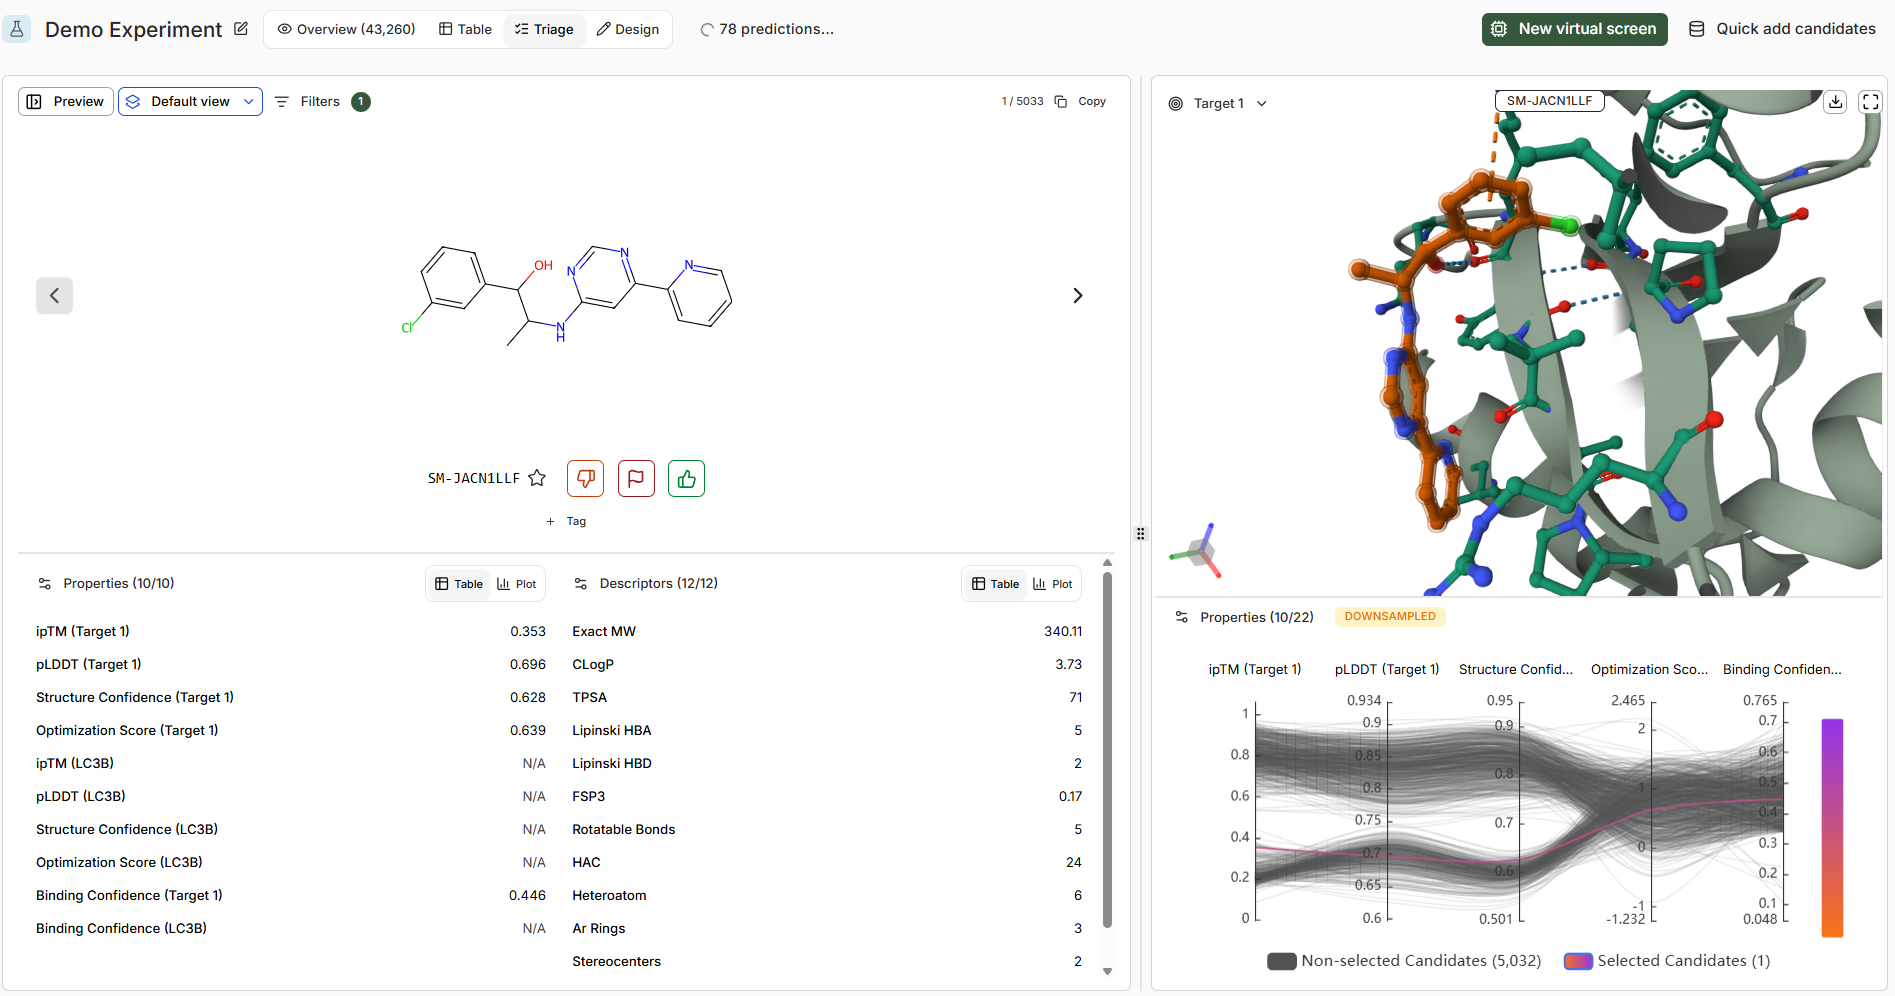 ### Triage Actions
Mark molecules you favor based on available data
Mark molecules you disfavor
Flexible marking for problematic predictions, chemical motifs, or molecules warranting discussion
Mark as 'active' to add to the Catalog
### Keyboard Shortcuts
| Action | Shortcut |
| ------------------------ | ------------------ |
| Previous / Next Molecule | **← →** arrow keys |
| Upvote / Downvote + Flag | **3** |
| Flag | **2** |
| Downvote | **1** |
### Tags
Tags allow free-form labelling shared across the Design Project. Multiple tags can be added to a molecule. When creating a new tag, a longer description can be provided while keeping the tag name short for a clean interface.
Select **Tags** from the left-hand menu to review all tags later.
***
## Catalog
The **Catalog** captures all 'active' molecules within a Design Project, forming a database across all Experiments and Virtual Screens.
### Triage Actions
Mark molecules you favor based on available data
Mark molecules you disfavor
Flexible marking for problematic predictions, chemical motifs, or molecules warranting discussion
Mark as 'active' to add to the Catalog
### Keyboard Shortcuts
| Action | Shortcut |
| ------------------------ | ------------------ |
| Previous / Next Molecule | **← →** arrow keys |
| Upvote / Downvote + Flag | **3** |
| Flag | **2** |
| Downvote | **1** |
### Tags
Tags allow free-form labelling shared across the Design Project. Multiple tags can be added to a molecule. When creating a new tag, a longer description can be provided while keeping the tag name short for a clean interface.
Select **Tags** from the left-hand menu to review all tags later.
***
## Catalog
The **Catalog** captures all 'active' molecules within a Design Project, forming a database across all Experiments and Virtual Screens.
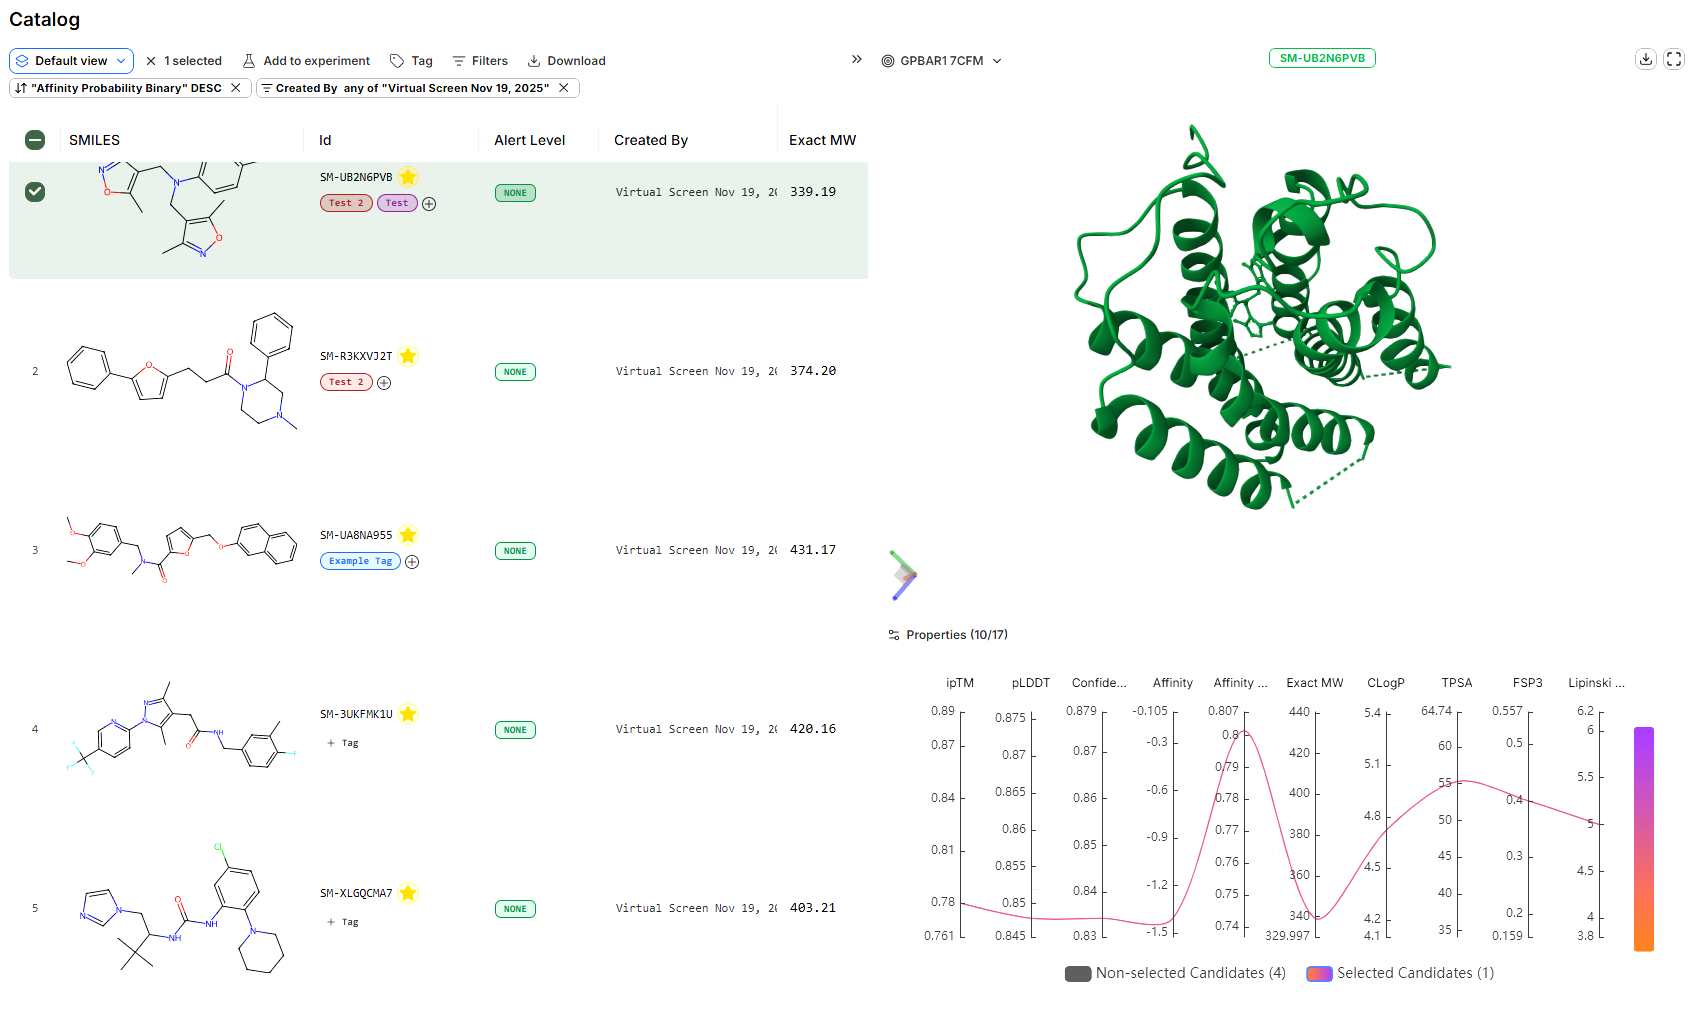 Active molecules in the Catalog are designs of particular interest to the Design Project team.
The Catalog shares the same features as the Table UI. Unchecking the ⭐ sets a molecule back to inactive and removes it from the Catalog.
### Recommended Workflow
1. Collaboratively (or independently) upvote, downvote, or flag molecules in the Table or Triage UI from a Virtual Screen
2. After all users have made triage recommendations, mark selected molecules as 'active' to add them to the Catalog
3. Use the Catalog as a shortlist for design review meetings or further analysis
Active molecules in the Catalog are designs of particular interest to the Design Project team.
The Catalog shares the same features as the Table UI. Unchecking the ⭐ sets a molecule back to inactive and removes it from the Catalog.
### Recommended Workflow
1. Collaboratively (or independently) upvote, downvote, or flag molecules in the Table or Triage UI from a Virtual Screen
2. After all users have made triage recommendations, mark selected molecules as 'active' to add them to the Catalog
3. Use the Catalog as a shortlist for design review meetings or further analysis