> ## Documentation Index
> Fetch the complete documentation index at: https://docs.boltz.bio/llms.txt
> Use this file to discover all available pages before exploring further.
# Experiments
> Track progress, interpret quality metrics, and manage running screens.
Once your virtual screen starts running, the platform continuously monitors prediction quality and tracks progress toward your screening objectives.
You can view live updates, respond to quality alerts, and adjust settings as needed.
***
## Experiment Overview
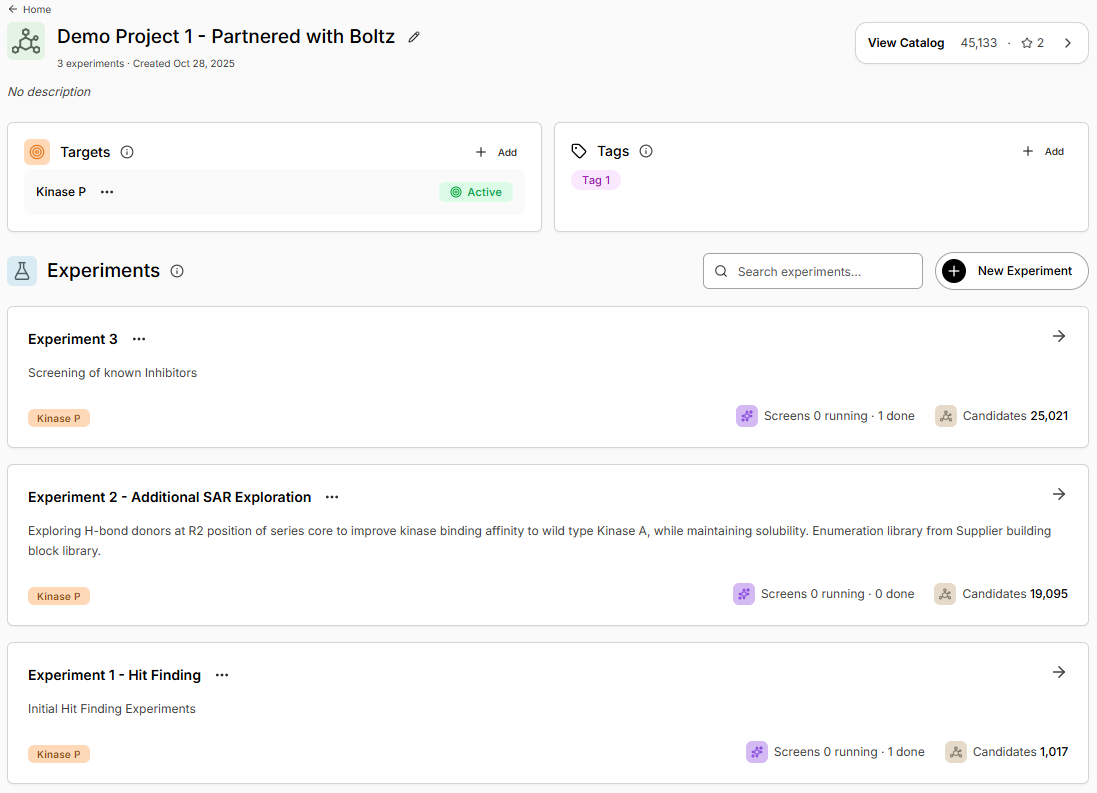
Selecting a **Project**, will display all \*\*Experiments \*\*within it.
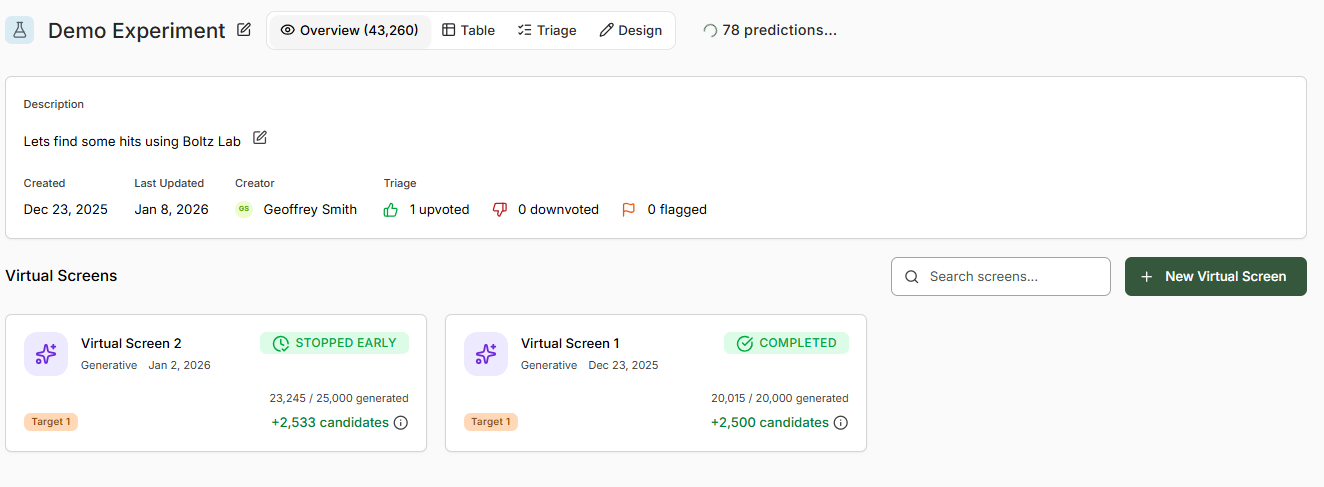
 The \*\*Overview\*\* tab provides a summary, and details all **Virtual Screens** nested within the **Experiment**.
 ## Virtual Screen Overview
Select a virtual screen to access the real-time monitoring dashboard.
## Virtual Screen Overview
Select a virtual screen to access the real-time monitoring dashboard.
 ### Status Overview
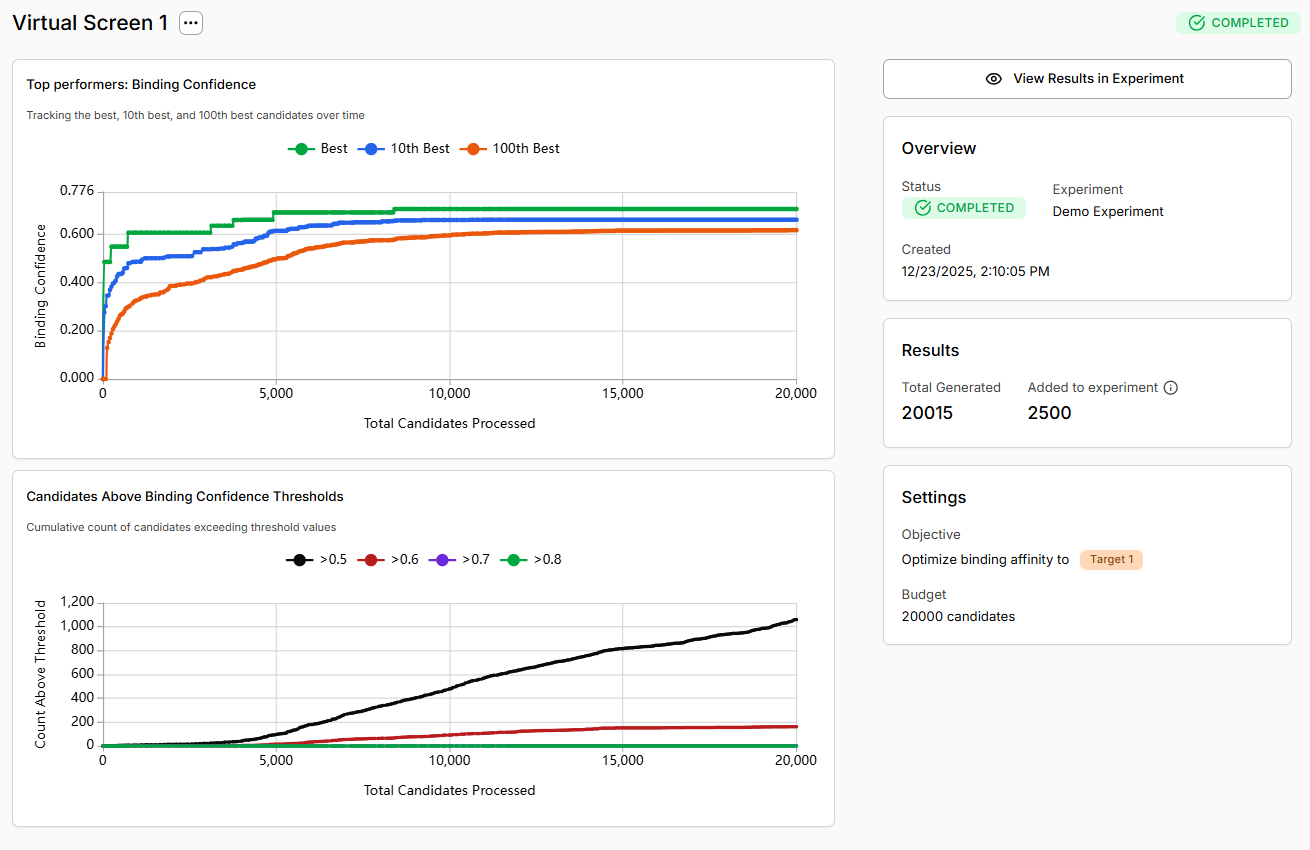
The right panel displays key information about your screen:
| Field | Description |
| -------------- | -------------------------------------------------------------- |
| **Status** | Current state: Running, Paused (awaiting review), or Completed |
| **Experiment** | Parent experiment name |
| **Created** | Start timestamp |
| **Duration** | Total runtime so far |
| **Expires in** | Days remaining before paused run is stopped (30 days) |
### Results Summary
Track screening progress in real-time:
| Metric | Meaning |
| ----------------------- | --------------------------------------------------------------------- |
| **Total Generated** | Total molecules that have been generated and scored by Boltz's agents |
| **Added to Experiment** | Molecules meeting criteria above binding confidence thresholds. |
### Settings Reminder
View your original screen configuration:
* **Objective:** The target you're optimizing binding affinity for
* **Budget:** Maximum number of molecules to generate (your computational budget)
***
## Interpreting Progress Charts
### Top Performers Chart
Tracks the binding confidence of the **best**, **10th best**, and **100th best** molecules over the course of the screen.
**What to look for:**
* **Rising green line (Best):** The best molecule keeps improving - the screen is finding better binders
* **Plateau after initial climb:** Normal behavior once the model converges on high-affinity scaffolds
* **All lines close together:** Limited chemical diversity or convergence
* **10th/100th best rising:** Good sign - you're finding multiple high-quality hits, not just one outlier
### Candidates Above Threshold Chart
Shows the cumulative count of molecules exceeding different binding confidence thresholds (**>0.5, >0.6, >0.7, >0.8**) as the screen progresses.
**What to look for:**
* **Black line (>0.5) rising steeply:** Many molecules predicted as likely binders
* **Green line (>0.8) accumulating:** High-confidence hits being discovered consistently
* **Flat lines:** Few molecules meeting thresholds - may indicate target difficulty or inappropriate chemistry
* **Only >0.5 line rising:** Moderate-confidence predictions but few strong hits
For hit discovery, prioritize **>0.7** candidates, however **>0.5** may be acceptable starting points.
***
## Managing Your Screen
Click the **three-dot menu** next to the virtual screen title to access management options:
### Available Actions
Navigate to the results and triage interface to analyze all scored molecules, regardless of whether the screen has completed. Useful for early decision-making during long screens.
Update the virtual screen name to better reflect its purpose or findings (e.g., "H-bond donor exploration" → "Series 1 SAR expansion").
Modify the computational budget (increase or decrease molecule count) and restart the screen.
**Use cases:**
* Increase budget if early results are promising and you want deeper exploration
* Decrease budget if you've already found sufficient hits and want to conserve resources
* Restart with adjusted molecular filters after reviewing initial outputs
Editing the budget and restarting will not discard the current progress.
***
## Paused vs. Running vs. Completed States
Your virtual screen will transition through different states:
| State | What It Means | What You Can Do |
| ------------- | ------------------------------------------------------------------------------------------------ | --------------------------------------------------- |
| **Running** | Actively generating and scoring molecules | Monitor progress, view live results |
| **Paused** | Automatically paused due to low ipTM alert
### Status Overview
The right panel displays key information about your screen:
| Field | Description |
| -------------- | -------------------------------------------------------------- |
| **Status** | Current state: Running, Paused (awaiting review), or Completed |
| **Experiment** | Parent experiment name |
| **Created** | Start timestamp |
| **Duration** | Total runtime so far |
| **Expires in** | Days remaining before paused run is stopped (30 days) |
### Results Summary
Track screening progress in real-time:
| Metric | Meaning |
| ----------------------- | --------------------------------------------------------------------- |
| **Total Generated** | Total molecules that have been generated and scored by Boltz's agents |
| **Added to Experiment** | Molecules meeting criteria above binding confidence thresholds. |
### Settings Reminder
View your original screen configuration:
* **Objective:** The target you're optimizing binding affinity for
* **Budget:** Maximum number of molecules to generate (your computational budget)
***
## Interpreting Progress Charts
### Top Performers Chart
Tracks the binding confidence of the **best**, **10th best**, and **100th best** molecules over the course of the screen.
**What to look for:**
* **Rising green line (Best):** The best molecule keeps improving - the screen is finding better binders
* **Plateau after initial climb:** Normal behavior once the model converges on high-affinity scaffolds
* **All lines close together:** Limited chemical diversity or convergence
* **10th/100th best rising:** Good sign - you're finding multiple high-quality hits, not just one outlier
### Candidates Above Threshold Chart
Shows the cumulative count of molecules exceeding different binding confidence thresholds (**>0.5, >0.6, >0.7, >0.8**) as the screen progresses.
**What to look for:**
* **Black line (>0.5) rising steeply:** Many molecules predicted as likely binders
* **Green line (>0.8) accumulating:** High-confidence hits being discovered consistently
* **Flat lines:** Few molecules meeting thresholds - may indicate target difficulty or inappropriate chemistry
* **Only >0.5 line rising:** Moderate-confidence predictions but few strong hits
For hit discovery, prioritize **>0.7** candidates, however **>0.5** may be acceptable starting points.
***
## Managing Your Screen
Click the **three-dot menu** next to the virtual screen title to access management options:
### Available Actions
Navigate to the results and triage interface to analyze all scored molecules, regardless of whether the screen has completed. Useful for early decision-making during long screens.
Update the virtual screen name to better reflect its purpose or findings (e.g., "H-bond donor exploration" → "Series 1 SAR expansion").
Modify the computational budget (increase or decrease molecule count) and restart the screen.
**Use cases:**
* Increase budget if early results are promising and you want deeper exploration
* Decrease budget if you've already found sufficient hits and want to conserve resources
* Restart with adjusted molecular filters after reviewing initial outputs
Editing the budget and restarting will not discard the current progress.
***
## Paused vs. Running vs. Completed States
Your virtual screen will transition through different states:
| State | What It Means | What You Can Do |
| ------------- | ------------------------------------------------------------------------------------------------ | --------------------------------------------------- |
| **Running** | Actively generating and scoring molecules | Monitor progress, view live results |
| **Paused** | Automatically paused due to low ipTM alert
Manually paused to review current progress | Review & Approve to continue, or Stop Run to cancel |
| **Completed** | Reached the budget limit or manual stop | View final results, triage molecules, export data |
Even in the **Running** state, you can click "View Results in Experiment" to start analyzing molecules that have already been scored - you don't have to wait for completion.
***
## Best Practices for Monitoring
For generative screens running 25,000+ molecules, check the dashboard once per day to catch issues early.
Review the apo structure, pocket definition, and early molecule structures to diagnose the issue if chemical hits do not look as expected.
If the top performers chart plateaus and the >0.8 threshold stops accumulating new molecules, the screen has likely converged. You may not need to run the full budget.
For well-validated targets (kinases, GPCRs), expect >0.7 binding confidence scores.
After 10,000-15,000 molecules in a generative screen, emerging patterns should be representative of overall trajectory.
***
## Troubleshooting Common Issues
**Likely cause:** Poor target structure quality or incorrect pocket definition.
**Solution:** Stop the screen, return to target setup, and:
* Add constraints to fix the apo structure conformation
* Redefine the binding pocket with more residues or probe molecules
* Consider using a crystal structure template instead of predicted structure
**Likely cause:** Chemical space mismatch, overly restrictive molecular filters, or target difficulty.
**Solution:**
* Review molecular filters - remove unnecessary restrictions (MW, LogP, HBD/HBA)
* Check if chemical space filter is excluding productive scaffolds
* For challenging targets, accept lower affinity thresholds (>0.5 instead of >0.7)
**Likely cause:** Generative model has converged on optimal scaffolds within the search space.
**Solution:** This is normal - you've found the candidate binders the agent is most confident on.
Stop the screen, triage results, and consider:
* Adjusting molecular filters to explore different chemical space
* Switching to library screening with novel scaffolds
* Moving successful hits into lead optimization cycles
***
## Understanding ipTM Alerts
During screening, Boltz monitors the **ipTM (interface predicted TM-score)** for each protein-ligand prediction. ipTM measures the model's confidence in the quality of the predicted protein-ligand interface - essentially how well the model believes the binding pose is resolved.
**ipTM in brief:** A score from 0-1 indicating the model's confidence that the protein-ligand interface structure is accurate, with higher scores meaning more reliable predictions.
### Low ipTM Score Alert
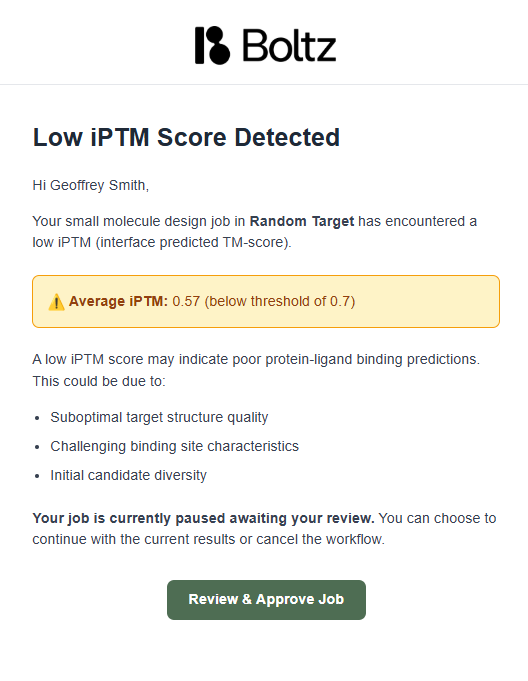
If the average ipTM score drops below the quality threshold (typically **0.7**), the platform automatically pauses your virtual screen and sends you an alert.
 **Why you received this alert:**
Low ipTM scores suggest the model is struggling to generate confident protein-ligand binding predictions. This could be caused by:
The model's understanding of structure may be poor, preventing proper ligand docking
Cryptic pockets, allosteric sites, or unusual binding modes that are difficult for the model to understand
Early molecules in generative screening may be exploring unsuitable chemical space
### What Should You Do?
You have two options when you receive a low ipTM alert:
**When to continue:**
* Target is inherently challenging (flexible binding sites, allosteric pockets) and low ipTM is expected
* You have high confidence in your apo structure and pocket definition
* You're willing to accept some lower-quality predictions to gather more data
The screen will resume from where it paused.
**When to stop:**
* You suspect the target structure or pocket definition is incorrect
* The candidate molecules are not appropriate for your target (wrong chemistry)
* You want to revisit constraints or pocket specification before continuing
Stop the run, review your target setup, and restart with adjustments.
**Why you received this alert:**
Low ipTM scores suggest the model is struggling to generate confident protein-ligand binding predictions. This could be caused by:
The model's understanding of structure may be poor, preventing proper ligand docking
Cryptic pockets, allosteric sites, or unusual binding modes that are difficult for the model to understand
Early molecules in generative screening may be exploring unsuitable chemical space
### What Should You Do?
You have two options when you receive a low ipTM alert:
**When to continue:**
* Target is inherently challenging (flexible binding sites, allosteric pockets) and low ipTM is expected
* You have high confidence in your apo structure and pocket definition
* You're willing to accept some lower-quality predictions to gather more data
The screen will resume from where it paused.
**When to stop:**
* You suspect the target structure or pocket definition is incorrect
* The candidate molecules are not appropriate for your target (wrong chemistry)
* You want to revisit constraints or pocket specification before continuing
Stop the run, review your target setup, and restart with adjustments.