Overview
After a virtual screen completes, candidates are available in your experiment for evaluation, triage, and further analysis.Experiment View
- Overview - Summary statistics and metrics
- Table - List view of all candidates with filters and sorting
- Triage - Organized view for candidate evaluation
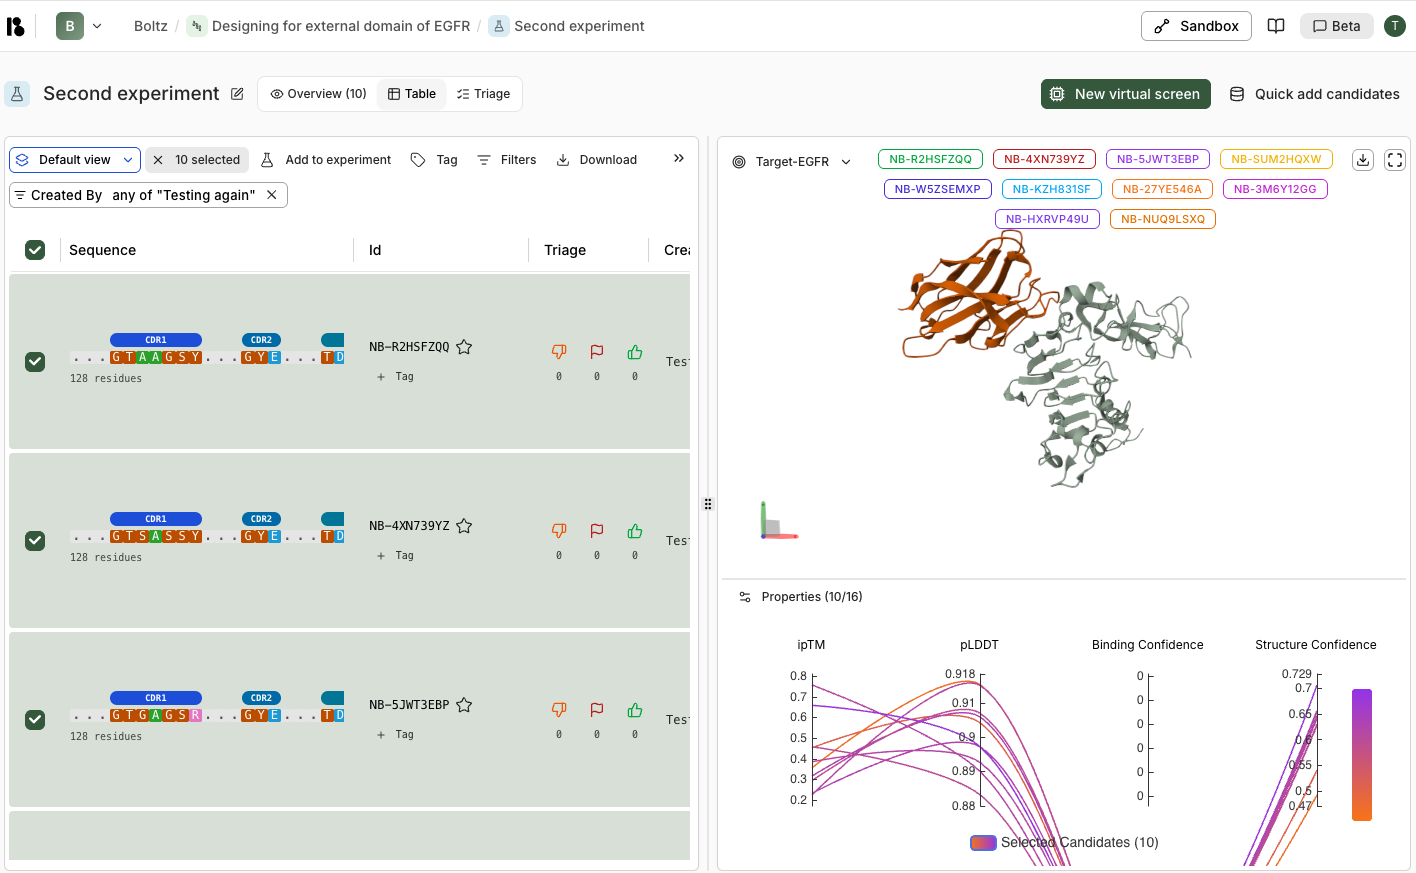
Candidate Table
Each candidate row shows:- Sequence - Protein sequence with CDR regions highlighted (for antibodies/nanobodies)
- Id - Unique identifier (e.g., NB-X7CMZA38)
- Triage - Thumbs down, flag, and thumbs up counts
- Created By - Which virtual screen generated this candidate
- Created - Timestamp when the candidate was generated
- Binding Confidence - Predicted binding affinity score for the target
- Structure Confidence - Overall structure quality score
Filtering and Selection
- Default view dropdown - Pre-configured filter sets
- Columns button - Show/hide table columns
- Filters button - Add custom filters including:
- Text filters - Filter by Id, Created By, etc.
- Number filters - Filter by ipTM, pLDDT, Binding Confidence, Structure Confidence, Loop Fraction using sliders
- Filter chips show active filters and can be removed individually
- Select candidates - Use checkboxes to select multiple candidates
- Download - Export selected candidates
Bulk Actions
When candidates are selected:- Add to experiment - Move to another experiment
- Tag - Apply tags for organization
- Download - Export candidate data
3D Visualization
The right panel shows:Target Selection
- Dropdown to switch between targets
- Selected candidate IDs displayed as colored tags
- Download and fullscreen options
3D Structure Viewer
- Interactive 3D ribbon diagram showing:
- Target (light grey)
- Binder candidates (colored by selection)
- 3D axis indicator for orientation
- Rotate, zoom, and pan controls
Properties Comparison
Compare metrics across selected candidates:- ipTM - Interface predicted Template Modeling score
- pLDDT - Predicted Local Distance Difference Test (structure confidence)
- Binding Confidence - Predicted binding affinity
- Structure Confidence - Overall structure quality
Triage View
The Triage tab provides a detailed view for evaluating individual candidates:Left Panel - Candidate Details
-
Sequence Viewer:
- Full protein sequence with Framework Regions (FR) and Complementarity Determining Regions (CDR) highlighted
- CDR regions color-coded (CDR1, CDR2, CDR3)
- Residue numbers displayed above sequence
- Navigation arrows to move between candidates
-
Candidate Actions:
- Star - Favorite a candidate
- Thumbs down - Reject candidate
- Flag - Mark for further review
- Thumbs up - Approve candidate
- + Tag - Apply tags for organization
-
Properties and Descriptors:
- Properties tab - View metrics (ipTM, pLDDT, Binding Confidence, Structure Confidence)
- Descriptors tab - View structural features (Loop Fraction, Helix Fraction, Sheet Fraction)
- Switch between Table and Plot views for each
Right Panel - 3D Structure and Comparison
-
3D Structure Viewer:
- Shows the selected candidate’s binding pose with the target
- Binder colored orange, target colored light grey/green
- Interactive controls for rotation, zoom, and pan
-
Properties Comparison:
- Parallel coordinates plot showing all candidates
- Selected candidate highlighted in purple
- Non-selected candidates shown in dark grey
- Compare across multiple properties simultaneously
Triage Workflow
- Select candidates - Use checkboxes or filters to narrow down
- Review 3D structures - Examine binding poses in the viewer
- Compare properties - Use charts to identify high-scoring candidates
- Triage actions:
- Thumbs down - Reject candidate
- Flag - Mark for further review
- Thumbs up - Approve candidate
- Tag candidates - Apply tags for organization (e.g., “high-affinity”, “interesting-pose”)
- Export - Download selected candidates for further analysis
Tips
- Start by filtering to top performers (high binding confidence)
- Review 3D structures to ensure poses are reasonable
- Compare multiple candidates side-by-side using the properties charts
- Use tags to organize candidates by different criteria
- Export promising candidates for experimental validation